The brief
Sightglass turns many data sources into one set of metrics. It is a simple idea that is hard to say, and the team had explained it four different ways on four different pages.
They wanted one explanation that held.
What we made
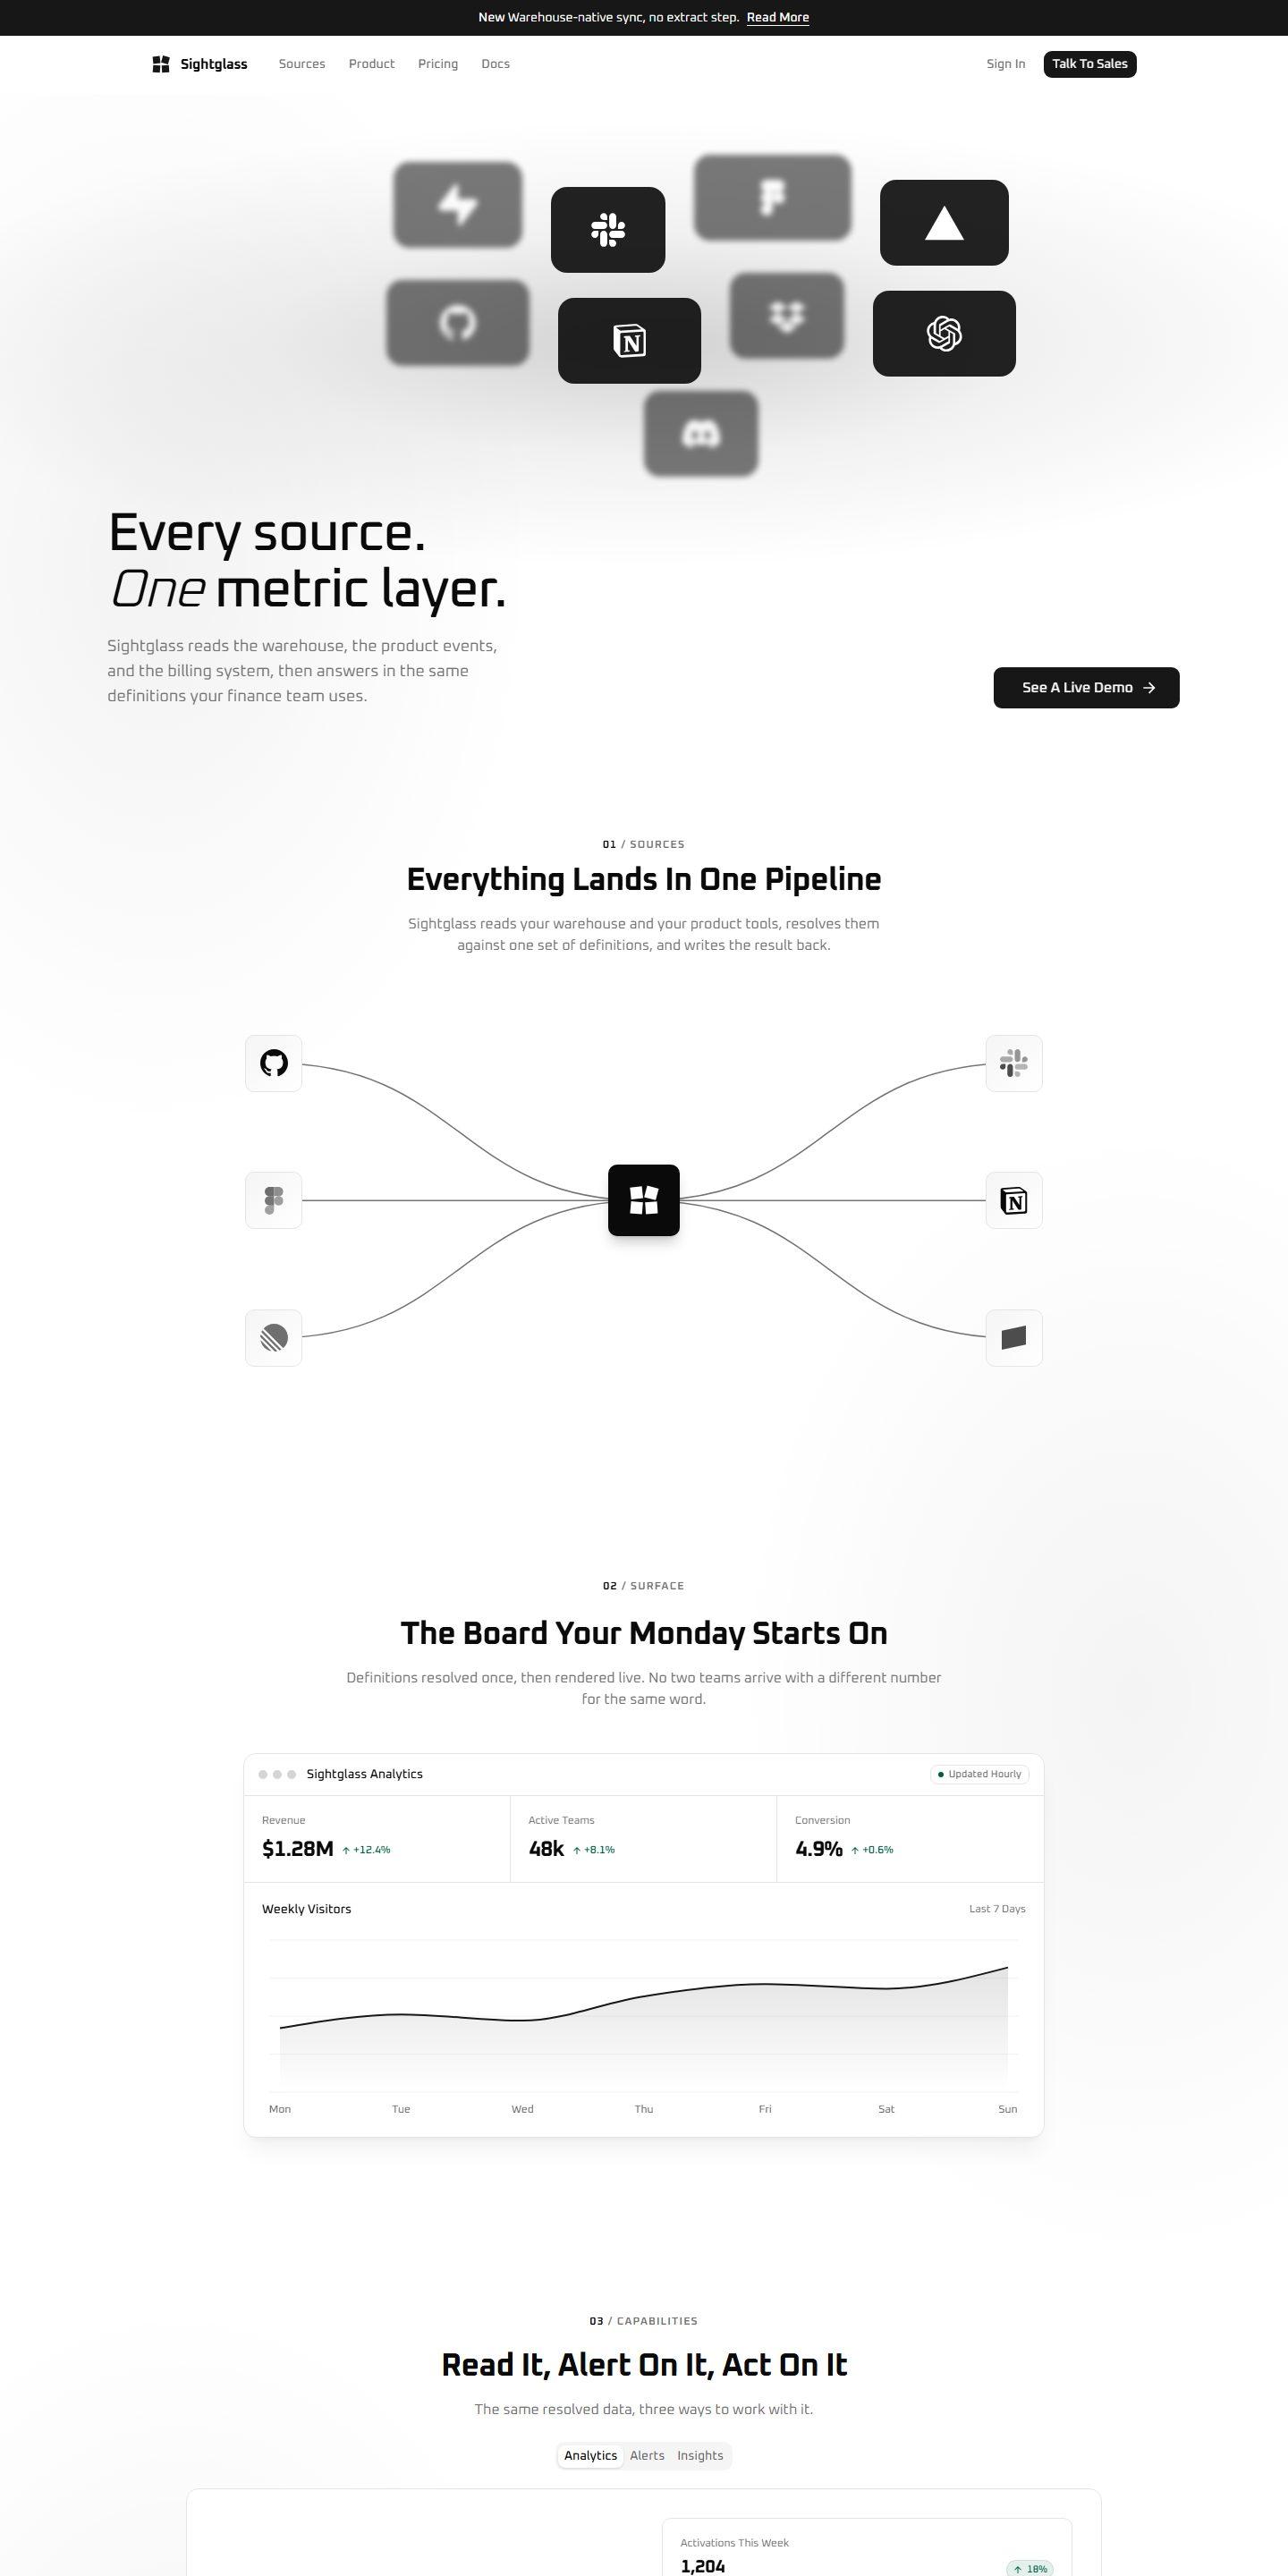
- One picture of the pipeline. Sources on the left, the metric layer in the middle, the tools people already use on the right.
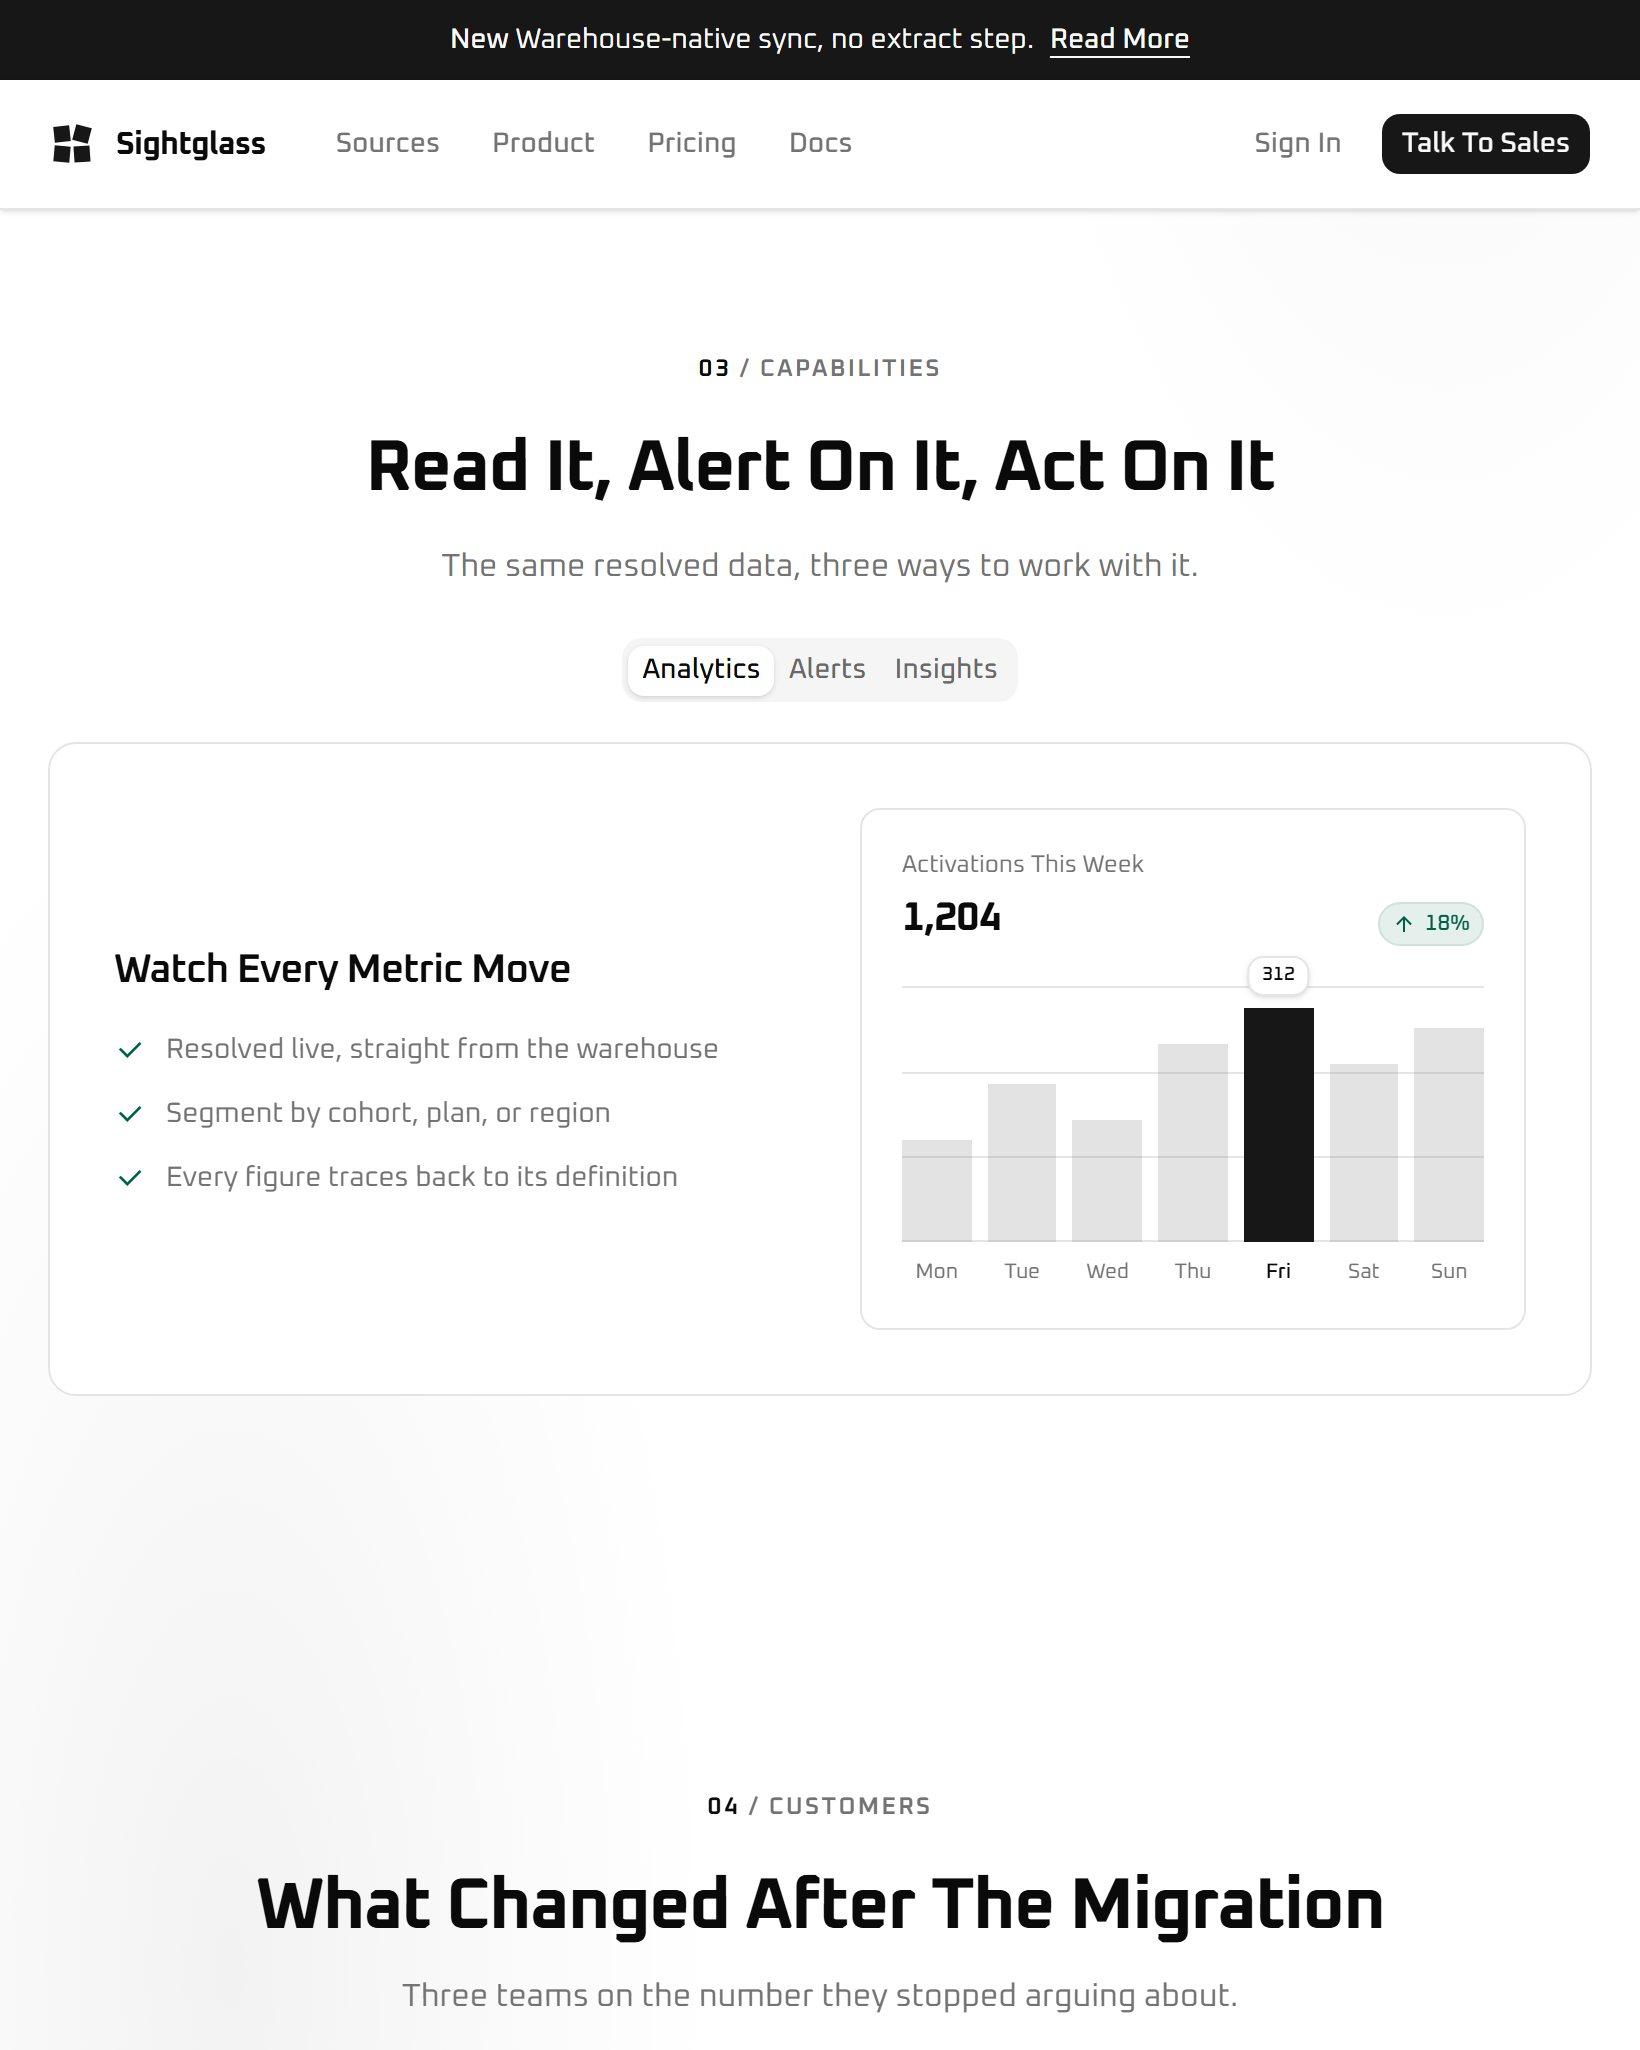
- The board itself, not a screenshot. The Monday dashboard is built in the page with believable numbers, so it stays sharp at every size.
- A pricing page with the arithmetic shown.
Get one page right and you have most of the design system.
How it went
The pipeline drawing went through eleven versions on paper before any design. Once it worked in black and white, the rest of the site took its shapes and spacing from it.